Benchmarks
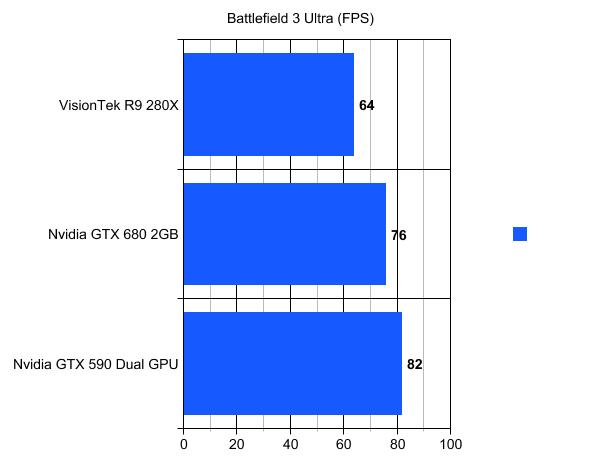
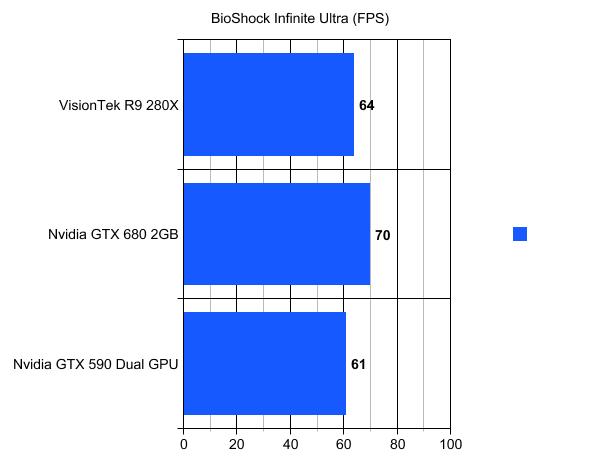
If you didn’t “get it” by the giant bit of text proceeding this paragraph, the VisionTek R9 280X has a lot of features built into its chipset. This is all well and good but, the most important question is obviously, how does it perform? We ran our PC gaming rig through several popular games as well as 3D Mark 11 to bring you the cold, hard numbers on the matter. Our testing rig features a Intel Core i7 3770K CPU, 16GB of RAM, ASUS Sabertooth Z87 motherboard, and 480GB OCZ Agility 3 SSD. Here are the various games and detail settings that we tested, as well as the resulting framerates.
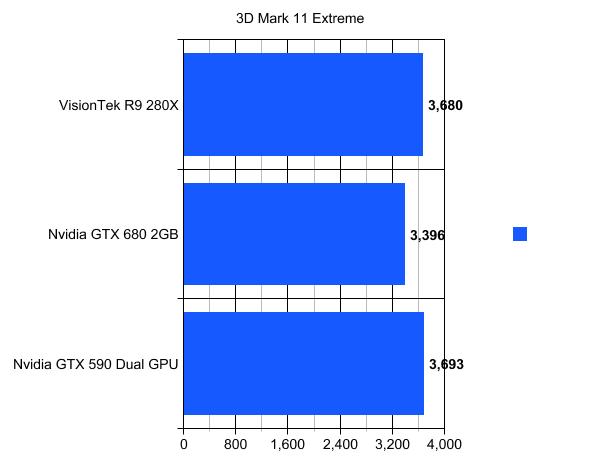
The final tests we put the VisionTek Radio R9 280X through was that of 3D Mark 11, a popular bench-marking program from the good people over at Futuremark. Here are the results:
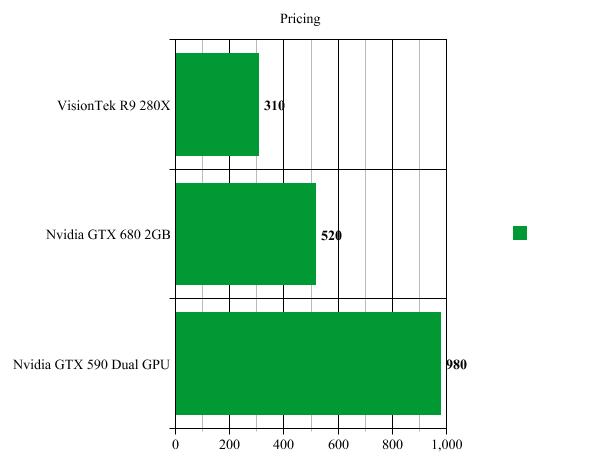
Some of you may be wondering why we are comparing the VisionTek R9 280X to the Nvidia GTX 590 platform. The reason is two fold: First, the 590 is a dual GPU solution that still is quite pricey when purchased on Amazon. Second, we only have the GTX 680 and GTX 590 to compare the R9 280X to, so we figured why not. Speaking of price, here is a comparison of the retail price of these GPUs:
As you can see from our graph, the VisionTek R9 280X provides amazing performance at a good deal cheaper than the Nvidia GTX 680 platform. The price for the Nvidia GTX 590 is taken from remaining new stock listed on Amazon.com (it is high because the 590 is a dual GPU product and a bit rare these days).

